I made create.withcode.uk a few years ago to try to make it as easy as possible for my computing students to interact with python code examples on any device. I wanted to be able to step through lines of code, discuss how it worked then share it with students in a way that let them tweak it, debug it, extend it and share it without the hassle of creating user accounts.
I’ve been thinking a lot recently about how to boost resilience and independence for students in a Computing classroom, particularly when it comes to debugging.
One thing that I’ve noticed that makes a big difference to students is if they’re taught early on how to use debugging tools like breakpoints, stepping and watches.
Step: running one line at a time to check the sequence of instructions runs in the order you’re expecting
Watch: checking the value of a variable as each line of code executes to see how data changes
Breakpoint: telling your code to pause when it gets to a particular line of code so that you can see what happens next
Useful debugging features of an Integrated Development Environment
Stepping and watching variable values has been possible for a while in create.withcode.uk but yesterday I released an update to allow you to set breakpoints on any line of code.
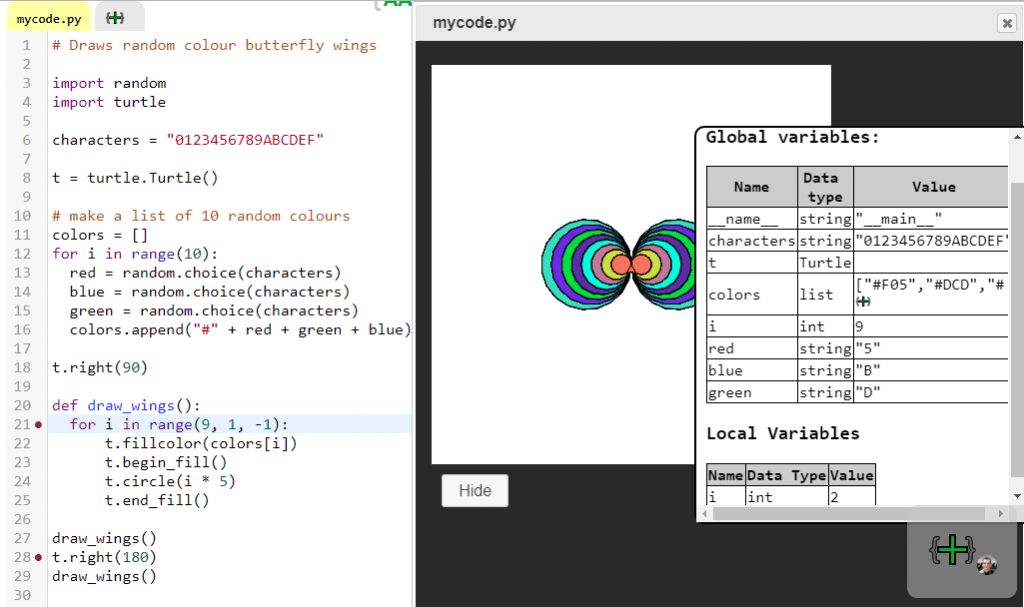
The above example shows some python code which will draw some butterfly in random colours.
On the right of the screen you can see the value of each global and local variable. This is really useful for explaining how data changes as your code runs.
The red blobs next to the line numbers show two breakpoints on line 21 and 28. You can toggle a breakpoint on or off by clicking on the line number.
To run the whole code (or up to a breakpoint) in create.withcode.uk, press Ctrl + Enter
To step through one line of code at a time, press Ctrl + .
To run the whole code (up to a breakpoint or the end of the program) press
Ctrl+Enter
To step through just one line of code press
Ctrl+Full Stop
instead. Try out the breakpoints in the example below:
It’s a work in progress, so let me know when you find any bugs or if you have any suggestions on how to improve it.
Happy debugging!


